
Python Data Analysis and Data Engineering
Learn Industry Level Data Cleaning, Data Preprocessing, And Advanced Feature Engineering. All You Need Is Covered!!
Total Data Science
Summary
- Reed courses certificate of completion - Free
Add to basket or enquire
Overview
What you'll learn
Master Data Analysis With Python
Master Beginner To Advance Level Data Analytics Techniques
Learn The Latest Data Analytics Skills And Techniques In 2021
Master How To Deal With Messy Data(outliers, missing values, data imbalance, data leakage etc.)
Know How To Deal With Complex Data Cleaning Issues In Python
Learn Automated Modern Tools And Libraries For Professional Data Cleaning And Analysis
Get The Skill Needed To Be Part Of The Top 10% Data Analytics and Data Science
Learn The Best Ways To Prepare Your Data To Build Machine Learning Models
Master Different Techniques Of Dealing With Raw Data
Master The Art Of Visualisation And Data Story Telling
Perform Industry Level Data Engineering
Certificates
Reed courses certificate of completion
Digital certificate - Included
Will be downloadable when all lectures have been completed
Curriculum
-
Section 1: Course Curriculum 06:24
-
Section 2: Welcome 00:31
-
Section 3: All Course Resources 01:00
-
Section 4: Introduction to Data Analysis 11:03
-
Section 5: Introduction To Jupyter Notebook 15:26
-
Section 6: Introduction To Google Colab 12:37
-
Section 7: Data Analysis Tools 04:06
-
Section 8: BONUS: Python Crash Course 6:52:35
-
Section 9: Levels Of Data Analysis Techniques 01:00
-
Section 10: Univariate Data Analysis 20:39
-
Section 11: Bivariate Data Analysis 04:56
-
Section 12: Multivariate Data Analysis 09:54
-
Section 13: Data Visualisation: Introduction To Data Visualisation Libraries 28:46
-
Section 14: Plot Different Types of Data Visualisations using Various Libraries 2:09:27
-
Section 15: Feature Engineering 10:27
-
Section 16: How To Deal With Data Types In Python 27:06
-
Section 17: Working With Data Types In Python 37:13
-
Section 18: How To Deal With Date And Time In Python 1:12:39
-
Section 19: How To Deal With Missing Values 54:16
-
Section 20: How To Deal With Outliers 43:10
-
Section 21: Automated Exploratory Data Analysis (EDA) 01:00
-
Section 22: Pandas Profiling 18:59
-
Section 23: Autoviz 10:39
-
Section 24: Sweetviz 13:31
-
Section 25: Dora 15:14
-
Section 26: How To Deal With Categorical Variables 22:18
-
Section 27: Feature Encoding 01:00
-
Section 28: Manual Encoding Of Categorical Variables 02:42
-
Section 29: Label Encoding 23:22
-
Section 30: One-Hot Encoding 09:55
-
Section 31: Get Dummies 03:43
-
Section 32: Curse Of Dimensionality 01:30
-
Section 33: Feature Harsher(The Hashing Trick) 04:59
-
Section 34: Variable/Feature Scaling 01:21
-
Section 35: What Is Normalisation? 04:15
-
Section 36: Standardisation 04:02
-
Section 37: Standard Scaler 17:09
-
Section 38: MinMax Scaler 04:56
-
Section 39: Robust Scaler 04:59
-
Section 40: Normaliser 03:49
-
Section 41: Variable/Feature Transformation 04:53
-
Section 42: Log Transformation 16:36
-
Section 43: Power Transformation: Box Cox Transformer 09:34
-
Section 44: Power Transformation: Yeo Johnson Transformer 04:30
-
Section 45: Polynomial Transformation 01:31
-
Section 46: Automated Feature Engineering Tools 01:00
-
Section 47: Feature Selector 44:07
-
Section 48: RFECV 24:31
-
Section 49: Feature Tools 38:56
-
Section 50: AutoFeat 07:57
-
Section 51: How To Deal With Imbalance Data 1:19:16
-
Section 52: How To Deal With Data Leakage 1:02:11
-
Section 53: Hands-On PROJECT 01:00
-
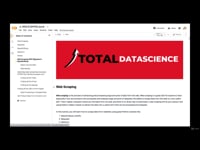
Section 54: Web Scraping 07:15
-
Section 55: Wikipedia Web Scraping 30:58
-
Section 56: Online BookStore Web Scrapping 55:40
-
Section 57: Web Scraping: Building Amazon Auto Scraper 43:32
Course media


Description
Interested in the field of Data Analytics, Business Analytics, Data Science or Machine Learning?
Do you want to know the best ways to clean data and derive useful insights from it?
Do you want to save time and easily perform Exploratory Data Analysis(EDA)?
Then this course is for you!!
According to Forbes: "60% of the Data Scientist's or Data Analyst's time is spent in cleaning and organising the data..."
In this course, you will not just get to know the industry level strategies but also I will practically demonstrate them for better understanding.
This course has been practically and carefully designed by industry experts to reflect the real-world scenario of working with messy data.
This course will help you learn complex Data Analytic techniques and concepts for easier understanding and data manipulations.
We will walk you through step-by-step on each topic explaining each line of code for your understanding.
This course has been structured in the following form:
Introduction To Basic Concepts
Introduction To Data Analysis Tools
BONUS: Python Crush Course
How To Properly Deal With Python Data Types
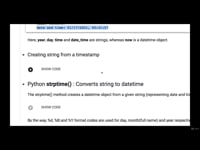
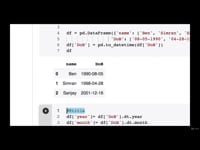
How To Properly Deal With Date and Time In Python
How To Properly Deal With Missing Values
How To Properly Deal With Outliers
How To Properly Deal With Data Imbalance
How To Properly Deal With Data Leakage
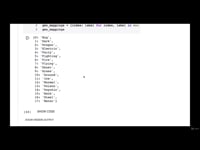
How To Properly Deal With Categorical Values
Beginner To Advanced Data Visualisation
Different Feature Engineering Techniques including:
Feature Encoding
Feature Scaling
Feature Transformation
Feature Normalisation
Automated Feature EDA Tools
pandas-profiling
Dora
Autoviz
Sweetviz
Automated Feature Engineering
RFECV
FeatureTools
FeatureSelector
Autofeat
Web scraping
Wikipedia
online bookstore
Amazon .com
This course aims to help beginners, as well as an intermediate data analyst, students, business analyst, data science, and machine learning enthusiasts, master the foundations of confidently working with data in the real world.
Who is this course for?
- This course is from a beginner level to advance level, and therefore anyone interested in learning basic to complex Data Analytics techniques for Data Science and Machine Learning is strongly advised to enrol.
- Anyone preparing for a career in Data Analytics, Data Science, Business Analytics, Business Intelligence, Machine Learning will highly find this course very useful.
- Any student ready to learn how to deal with complex machine learning problems such as imbalance data, data leakage, basic to advanced Feature Engineering etc. is strongly recommended to enrol.
- Anyone who is looking for a career transition to Data Analytics, Data Science, Business Analytics, Business Intelligence, Machine Learning role and wants to understand the concepts very well from scratch is recommended to enrol.
Requirements
This course is a beginner to advance level course with a step-by-step walk through.
If you are a complete beginner, you have all the lessons from introduction to python to dealing with complex data issues and building a web-scraper.
If you already have the basics in Python, feel free to skip the Python Crush course at the BONUS session.
Questions and answers
Currently there are no Q&As for this course. Be the first to ask a question.
Reviews
Currently there are no reviews for this course. Be the first to leave a review.

Add to basket or enquire
Course provided by
Legal information
This course is advertised on reed.co.uk by the Course Provider, whose terms and conditions apply. Purchases are made directly from the Course Provider, and as such, content and materials are supplied by the Course Provider directly. Reed is acting as agent and not reseller in relation to this course. Reed's only responsibility is to facilitate your payment for the course. It is your responsibility to review and agree to the Course Provider's terms and conditions and satisfy yourself as to the suitability of the course you intend to purchase. Reed will not have any responsibility for the content of the course and/or associated materials.